Convolutional Neural Network, A Bird’s Eye View With An Implementation
Published:
This article is aimed at giving a simple understanding of a Convolutional Neural Network (CNN).
This will be achieved in the following order:
- Understanding the Convolution operation
- Understanding Neural Networks
- Pre-Processing the data
- Understanding the CNN used
- Understanding Optimizers
- Understanding
ImageDataGenerator - Making the predictions and calculating the accuracy
- Seeing a Neural Network in Action
What is Convolution?
In mathematics (and, in particular, functional analysis) convolution is a mathematical operation on two functions (f and g) to produce a third function that expresses how the shape of one is modified by the other.
(Source: Wikipedia)
This operation is used in several areas such as probability, statistics, computer vision, natural language processing, image and signal processing, engineering, and differential equations.
This operation is mathematically represented as

(Image Source: Wikipedia)
Checkout this link for a visual understanding of the Convolution operation.
What are Artificial Neural Networks?
Artificial neural networks (ANN) or connectionist systems are computing systems vaguely inspired by the biological neural networks that constitute animal brains. Such systems “learn” to perform tasks by considering examples, generally without being programmed with any task-specific rules.
(Source: Wikipedia)
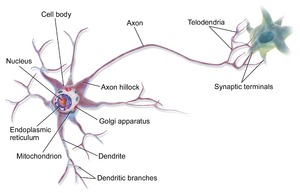
An ANN is a has a collection of smaller processing units called the artificial neurons which loosely resemble the biological neuron.
Biological Neural Circuit

(Image Source: Wikipedia)
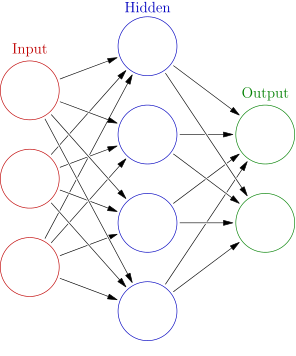
A collection of interconnected circuits make a network
Artificial Neural Network

(Image Source: Wikipedia)
Now, we begin with the implementation
Importing the necessary libraries
import numpy as np
import pandas as pd
import matplotlib.pyplot as plt
import seaborn as sns

import tflearn.data_utils as du
from keras.models import Sequential
from keras.layers import Dense, Dropout, Flatten, Conv2D, MaxPool2D
from keras.optimizers import RMSprop
from keras.preprocessing.image import ImageDataGenerator
from sklearn.metrics import confusion_matrix
Loading the dataset
train_data = pd.read_csv('../input/csvTrainImages 13440x1024.csv', header = None)
train_label = pd.read_csv('../input/csvTrainLabel 13440x1.csv', header = None)
test_data = pd.read_csv('../input/csvTestImages 3360x1024.csv', header = None)
test_label = pd.read_csv('../input/csvTestLabel 3360x1.csv', header = None)
The Dataset
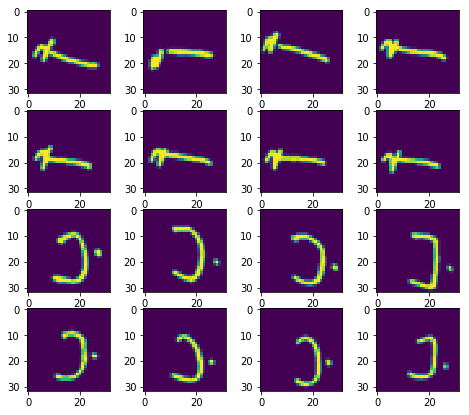
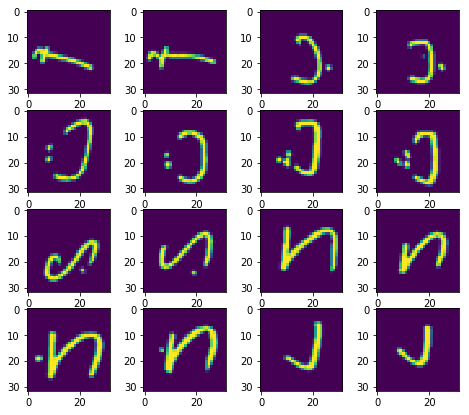
The dataset used here is the Arabic Handwritten Characters Dataset.
The trainImages.csv has 1024 columns and 13440 rows. Each column represents a pixel in an image and each row represents an individual gray-scale image. The value of each pixel varies from 0 -255.
train_data = train_data.iloc[:,:].values.astype('float32')
train_label = train_label.iloc[:,:].values.astype('int32')-1
test_data = test_data.iloc[:,:].values.astype('float32')
test_label = test_label.iloc[:,:].values.astype('int32')-1
Visualizing the dataset
def row_calculator(number_of_images, number_of_columns):
    if number_of_images % number_of_columns != 0:
        return (number_of_images / number_of_columns)+1
    else:
        return (number_of_images / number_of_columns)
def display_image(x, img_size, number_of_images):
    plt.figure(figsize = (8, 7))
    if x.shape[0] > 0:
        n_samples = x.shape[0]
        x = x.reshape(n_samples, img_size, img_size)
        number_of_rows = row_calculator(number_of_images, 4)
        for i in range(number_of_images):
            plt.subplot(number_of_rows, 4, i+1)
            plt.imshow(x[i])
The training set
display_image(train_data, 32, 16)

The test set
display_image(test_data, 32, 16)

Data preprocessing
Encoding categorical variables
What are Categorical Variables?
In statistics, a categorical variable is a variable that can take on one of a limited, and usually fixed number of possible values, assigning each individual or other unit of observation to a particular group or nominal category on the basis of some qualitative property.
(Source: Wikipedia)
In simple terms, the value of a categorical variable represents a category or class.
Why do we need to Encode Categorical Variables?
There is no meaning in performing operations on a number representing a category. So, categorical encoding needs to be done.
Check out this link on stackoverflow to understand with an example.
There are 28 letters in the Arabic alphabet. Therefore, there are 28 classes.
train_label = du.to_categorical(train_label,28)
Normalization
What is Normalization?
Normalization is done to bring the entire data into a well defined range, preferably between 0 and 1
In neural networks, it is good idea not just to normalize data but also to scale them. This is intended for faster approaching to global minima at error surface.
(Source: Stack Overflow)
train_data = train_data/255
test_data = test_data/255
train_data = train_data.reshape([-1, 32, 32, 1])
test_data = test_data.reshape([-1, 32, 32, 1])
Reshaping is done to make the data represent a 2D image
train_data, mean1 = du.featurewise_zero_center(train_data)
test_data, mean2 = du.featurewise_zero_center(test_data)
Feature-wise Zero Center is done to zero center every sample with specified mean. If not specified, the mean is evaluated over all samples.
Building the CNN
recognizer = Sequential()
recognizer.add(Conv2D(filters = 32, kernel_size = (5,5),padding = 'Same', activation ='relu', input_shape = (32,32,1)))
recognizer.add(Conv2D(filters = 32, kernel_size = (5,5),padding = 'Same', activation ='relu'))
recognizer.add(MaxPool2D(pool_size=(2,2)))
recognizer.add(Dropout(0.25))
recognizer.add(Conv2D(filters = 64, kernel_size = (3,3),padding = 'Same', activation ='relu'))
recognizer.add(Conv2D(filters = 64, kernel_size = (3,3),padding = 'Same', activation ='relu'))
recognizer.add(MaxPool2D(pool_size=(2,2), strides=(2,2)))
recognizer.add(Dropout(0.25))
recognizer.add(Flatten())
recognizer.add(Dense(units = 256, input_dim = 1024, activation = 'relu'))
recognizer.add(Dense(units = 256, activation = "relu"))
recognizer.add(Dropout(0.5))
recognizer.add(Dense(28, activation = "softmax"))
What is Max Pooling?
Pooling means combining a set of data. The process of combining data follows some rules.
By definition, max pool takes the maximum value of a defined grid.
(Source: machinelearningonline.blog)
Max pooling is used to reduce the dimensions. It can also avoid over-fitting. Check out this blog for a better understanding on Max Pooling.
What is Dropout?
Dropout is a regularization technique for reducing overfitting in neural networks by preventing complex co-adaptations on training data. It is a very efficient way of performing model averaging with neural networks. The term “dropout” refers to dropping out units (both hidden and visible) in a neural network.
(Source: Wikipedia))
What is Flatten?
Flattening is done to convert the multidimensional data into a 1D feature vector to be used by the next layer which is the Dense Layer
What is a Dense Layer?
The Dense layer is just a layer of Artificial Neural Network. It is also called the fully connected layer.
Optimizer for the CNN
What is an optimizer?
Optimization algorithms helps us to minimize (or maximize) an Objective function (another name for Error function) E(x) which is simply a mathematical function dependent on the Model’s internal learnable parameters which are used in computing the target values(Y) from the set of predictors(X) used in the model. For example — we call the Weights(W) and the Bias(b) values of the neural network as its internal learnable parameters which are used in computing the output values and are learned and updated in the direction of optimal solution i.e minimizing the Loss by the network’s training process and also play a major role in the training process of the Neural Network Model .
(Source: Towards Data Science)
optimizer = RMSprop(lr=0.001, rho=0.9, epsilon=1e-08, decay=0.0)
The optimizer used here is an RMSprop. Click here to know more about RMSprop
recognizer.compile(optimizer = optimizer , loss = "categorical_crossentropy", metrics=["accuracy"])
What is ImageDataGenerator?
Image data generator is used to generate batches of tensor image data with real time augmentation. This data is looped over in batches.
It is used to load the images in batches.
datagen = ImageDataGenerator(
        featurewise_center=False,
        samplewise_center=False,
        featurewise_std_normalization=False,
        samplewise_std_normalization=False,
        zca_whitening=False,
        rotation_range=10,
        zoom_range = 0.1,
        width_shift_range=0.1,
        height_shift_range=0.1,
        horizontal_flip=False,
        vertical_flip=False)
datagen.fit(train_data)
Fitting the CNN to the training data
recognizer.fit_generator(datagen.flow(train_data,train_label, batch_size=100), epochs = 30, verbose = 2, steps_per_epoch=train_data.shape[0] // 100)
Making the predictions
predictions = recognizer.predict(test_data)
predictions = np.argmax(predictions,axis = 1)
Evaluating the model
Generating a confusion matrix
What is a Confusion matrix?
A confusion matrix is a technique for summarizing the performance of a classification algorithm. Classification accuracy alone can be misleading if you have an unequal number of observations in each class or if you have more than two classes in your dataset. Calculating a confusion matrix can give you a better idea of what your classification model is getting right and what types of errors it is making.
cm = confusion_matrix(test_label, predictions)
Calculating the accuracy
accuracy = sum(cm[i][i] for i in range(28)) / test_label.shape[0]
print("accuracy = " + str(accuracy))
An accuracy of 97% was obtained
Seeing a CNN in action
To see the working of a CNN in real time, check out this link. It shows the working of a CNN that is trained to recognize handwritten digits.

